
← Go back

A sales CRM your small team will actually use

Built in 19 minutes with 5 prompts. See exactly how it was made, then create your own version in seconds with Macaly.

CRM application built with Macaly AI Builder
AI generation

1. Describe the CRM and get a working product

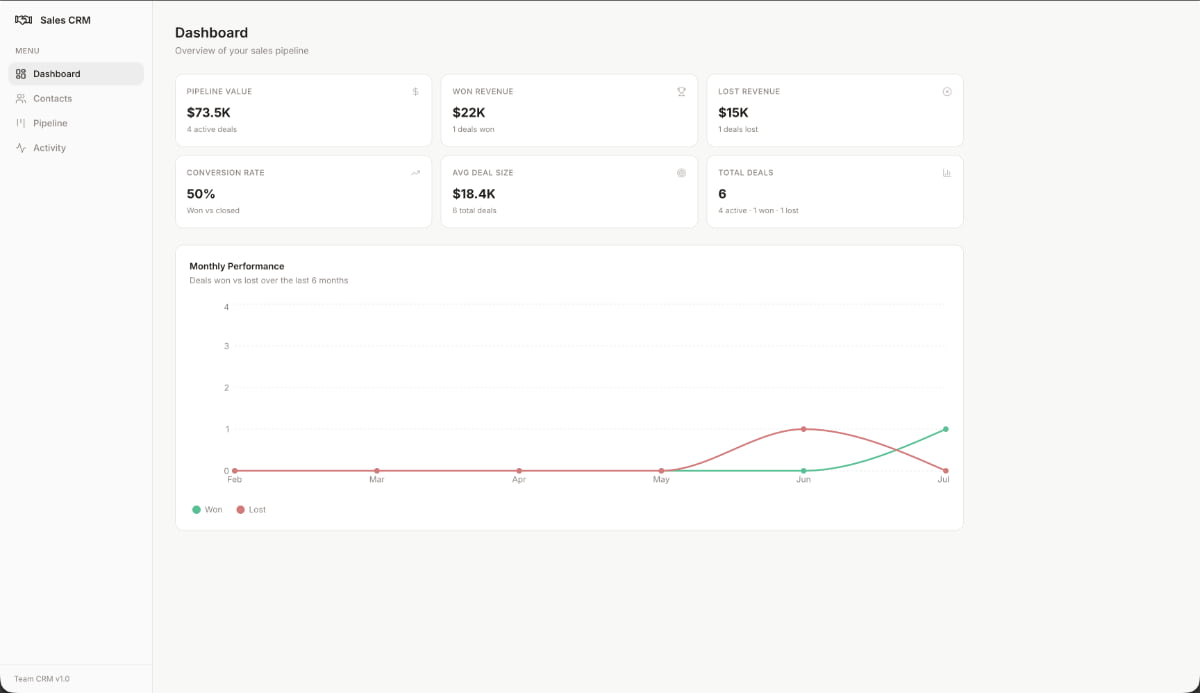
One single prompt. It built the entire app: a dashboard with pipeline value, revenue earned, conversion rate and total deal count, a monthly performance chart and views for contacts, pipeline and activities. Clean light theme with navy blue accents.

“Create me a simple sales CRM for a small team. A dashboard with pipeline value, revenue earned, conversion rate and total deal count, a monthly performance chart and pages for contacts, pipeline and activities. Keep it clean and simple, no clutter.”

Database

2. Make deals persistent

Deals, contacts and notes have been moved to a real database: every change syncs immediately and nothing is lost on page reload. Stage changes are logged with date and time.

“Save contacts and deals to a database. When I move a deal in the pipeline, save the stage change with date and time.”

Charts

3. Add won/lost reports

One single sentence produced the monthly performance chart: won and lost deals over six months, with clear legends and proper handling of empty states.

“Add a monthly performance chart that compares won and lost deals over the last six months.”

Authentication & roles

4. Invite your team

Role-based access: admins manage everything, while sales reps only see their own deals. Sessions are handled automatically, with no setup screens.

“Add access for my team. Admins see all deals, sales reps only their own.”

Custom design

5. Polish

Consistent metric cards, keyboard shortcuts for the pipeline and 14 tests written for the entire codebase. Zero errors.

“Fix the dashboard spacing and make the metric cards consistent.”

What the agent did

Real-time pipeline metrics

Pipeline value, revenue earned, conversion rate and deal count update in real time as deals change stage.

Won & lost trend

A monthly chart shows won and lost deal lines over six months, generated from real data rather than manually entered numbers.

Role-based access

Admins manage every deal; sales reps see their own. All set up with one sentence, no admin console needed.

Activity log

Every call, note and stage change is logged automatically for each contact, so context is never lost.

Clean, focused design

Light theme, navy blue accents, four metric cards and one chart. Nothing the team won't use.

14 tests, zero errors

Deal logic, permissions and rendering verified before delivery.

Create yours in minutes

1_ Create your free account 2_ Describe your idea 3_ Publish right away